
Dashboards
Analytical Dashboards / Charts / User Management / Content Management System
My role
Timeline
Team size
Link
Product
A powerful B2B platform offering customized collateral creation, personalized video content, and digital asset management. It enables businesses to execute personalized campaigns, organize digital assets with AI, and streamline fulfillment across digital and print channels while maintaining brand standards and regulatory compliance.
USers
Clients' employees use the platform to access data and analytics on marketing campaigns, video performance, and digital assets, enhancing their decision-making and strategic planning.
Context
I worked in a team consisting of developers, a business analyst, a QA tester, and a project manager, collaborating with stakeholders to build a dashboard from scratch. The goal was to leverage existing data and align it with the needs of clients.
activities
- Competitor Analysis
- Workshop "Service Blueprint"
- Persona Creation
- Design System Creation
- Edge Cases Prediction
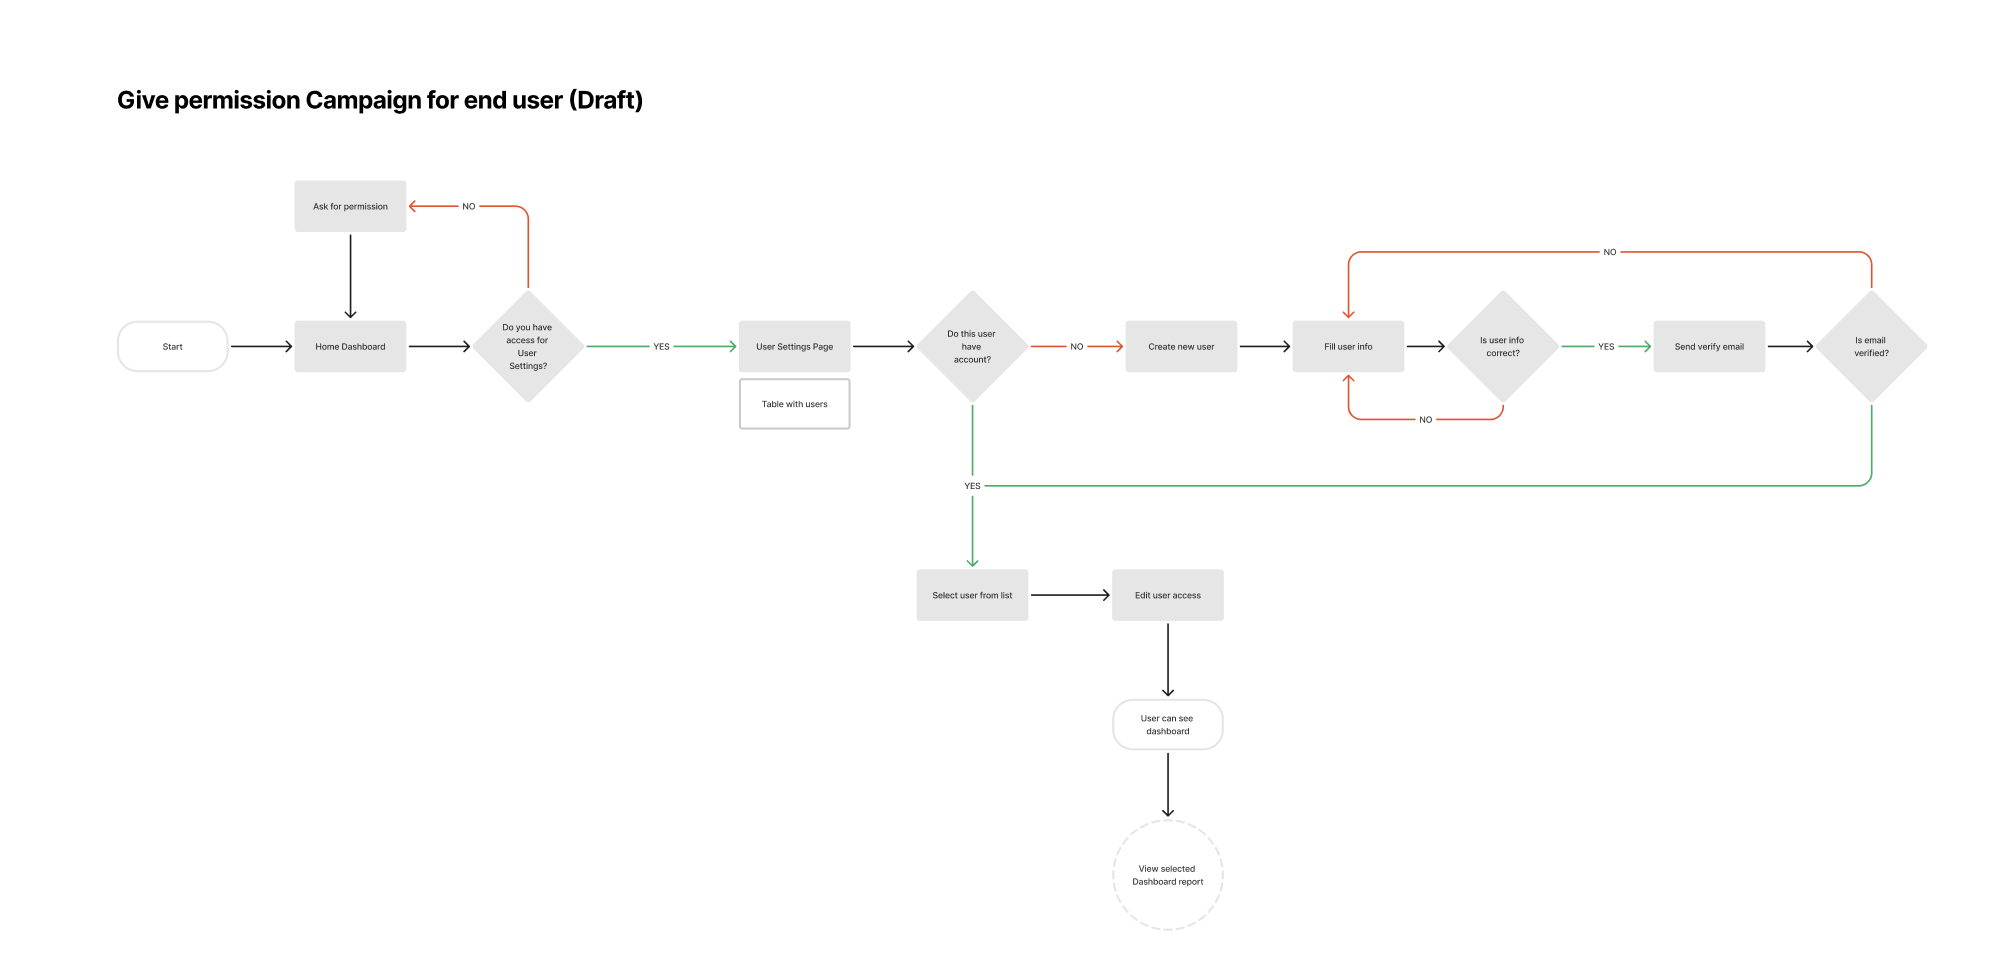
Problem
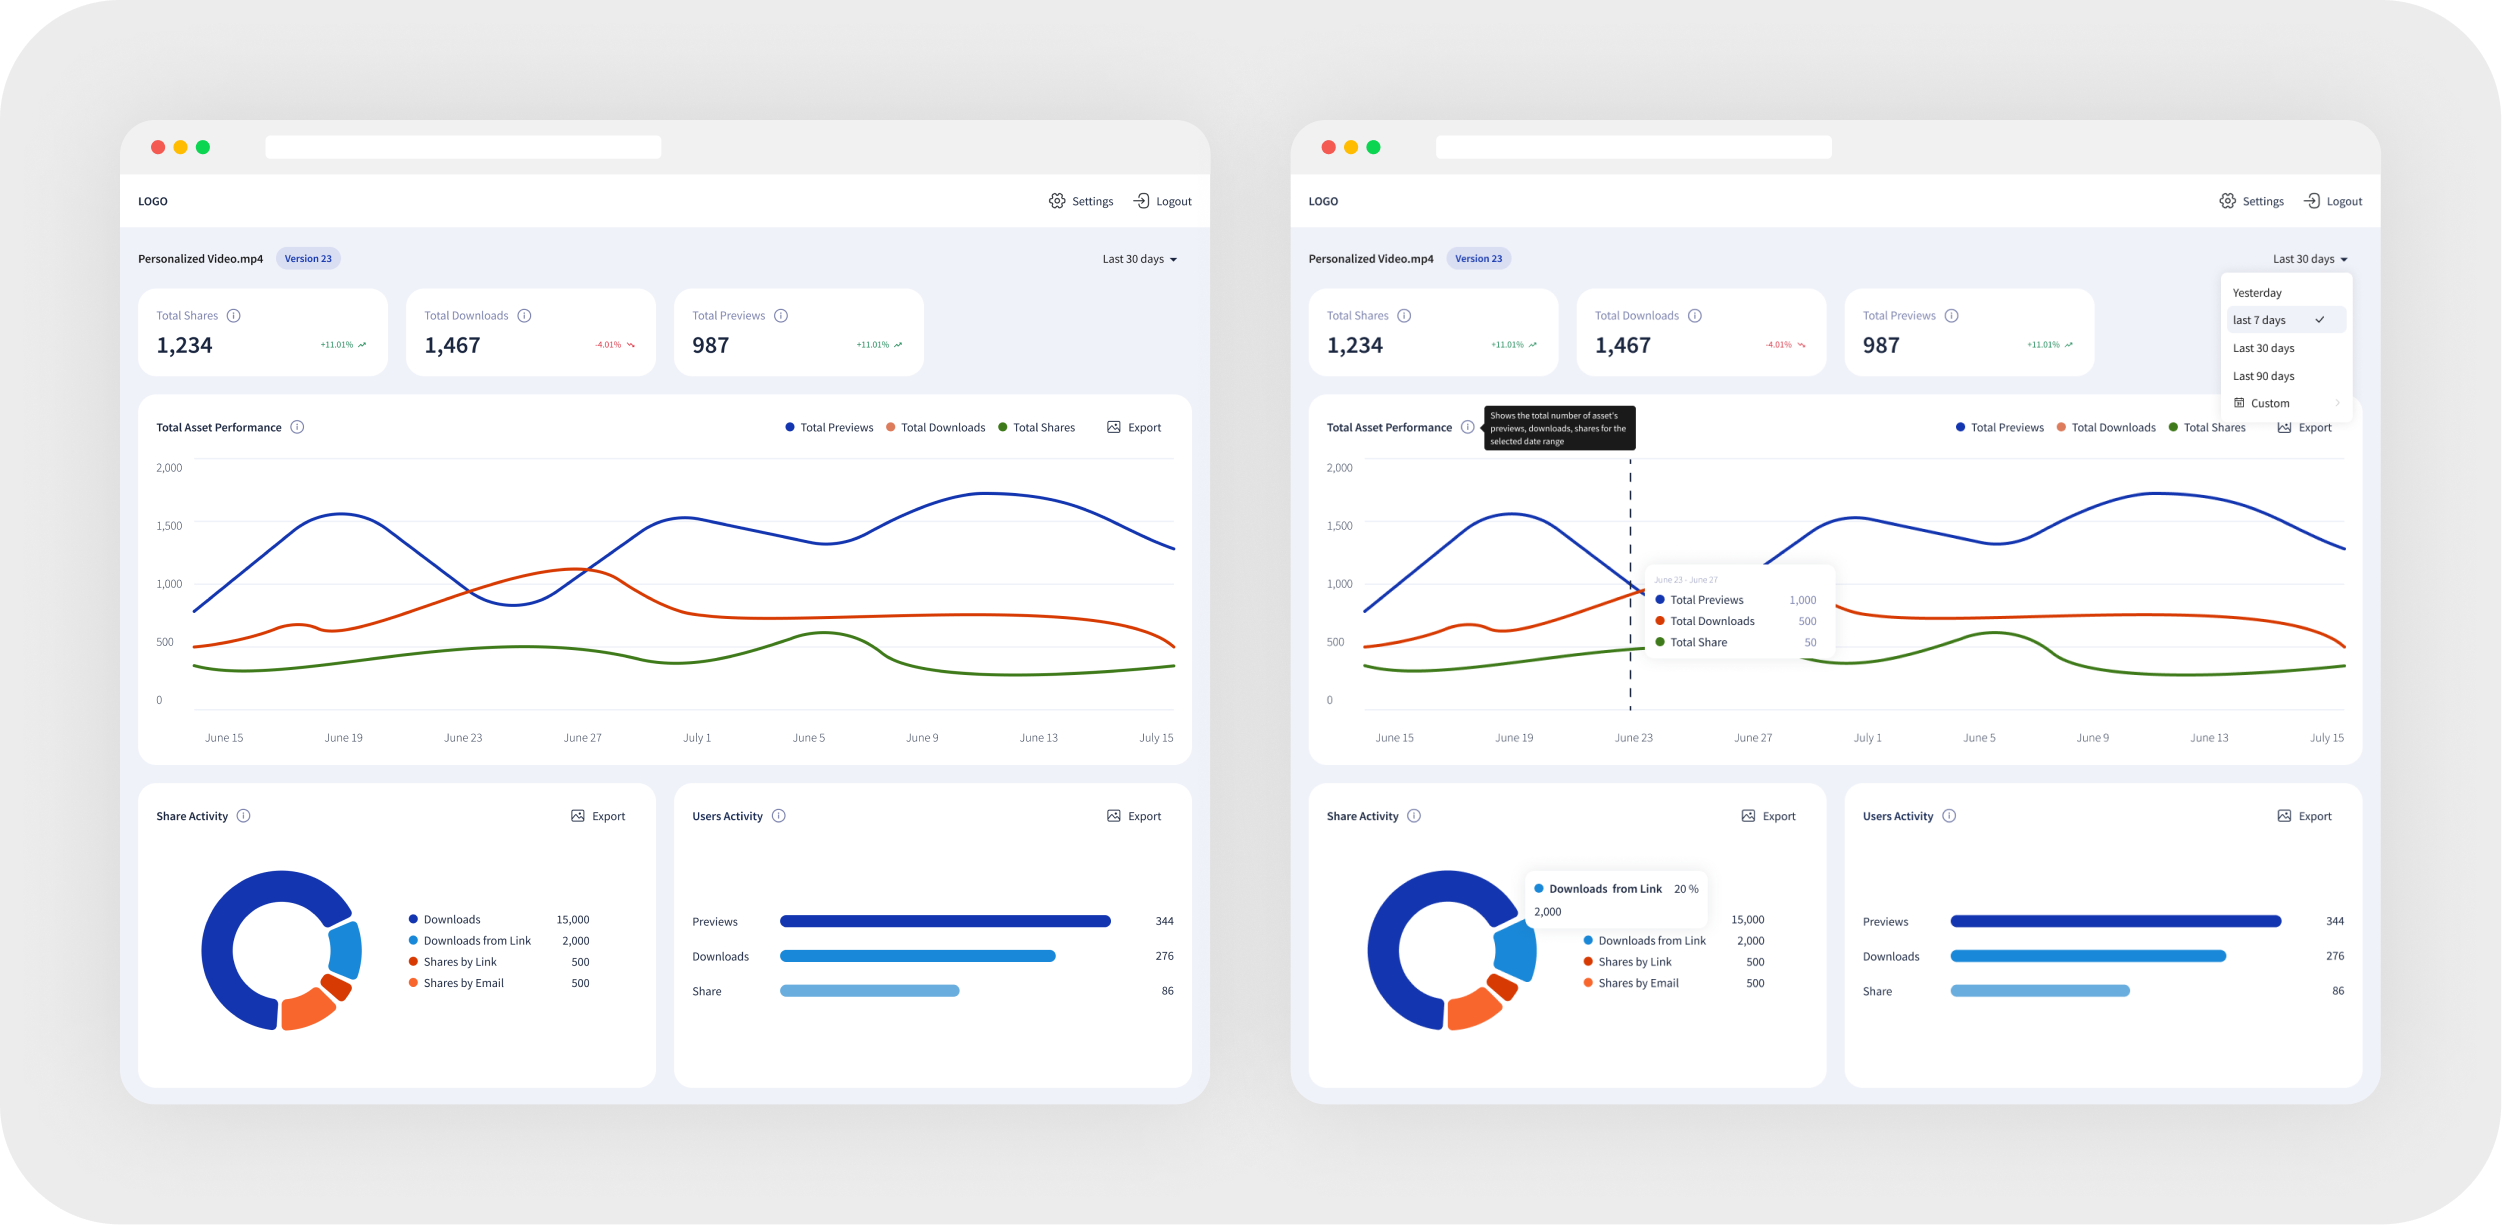
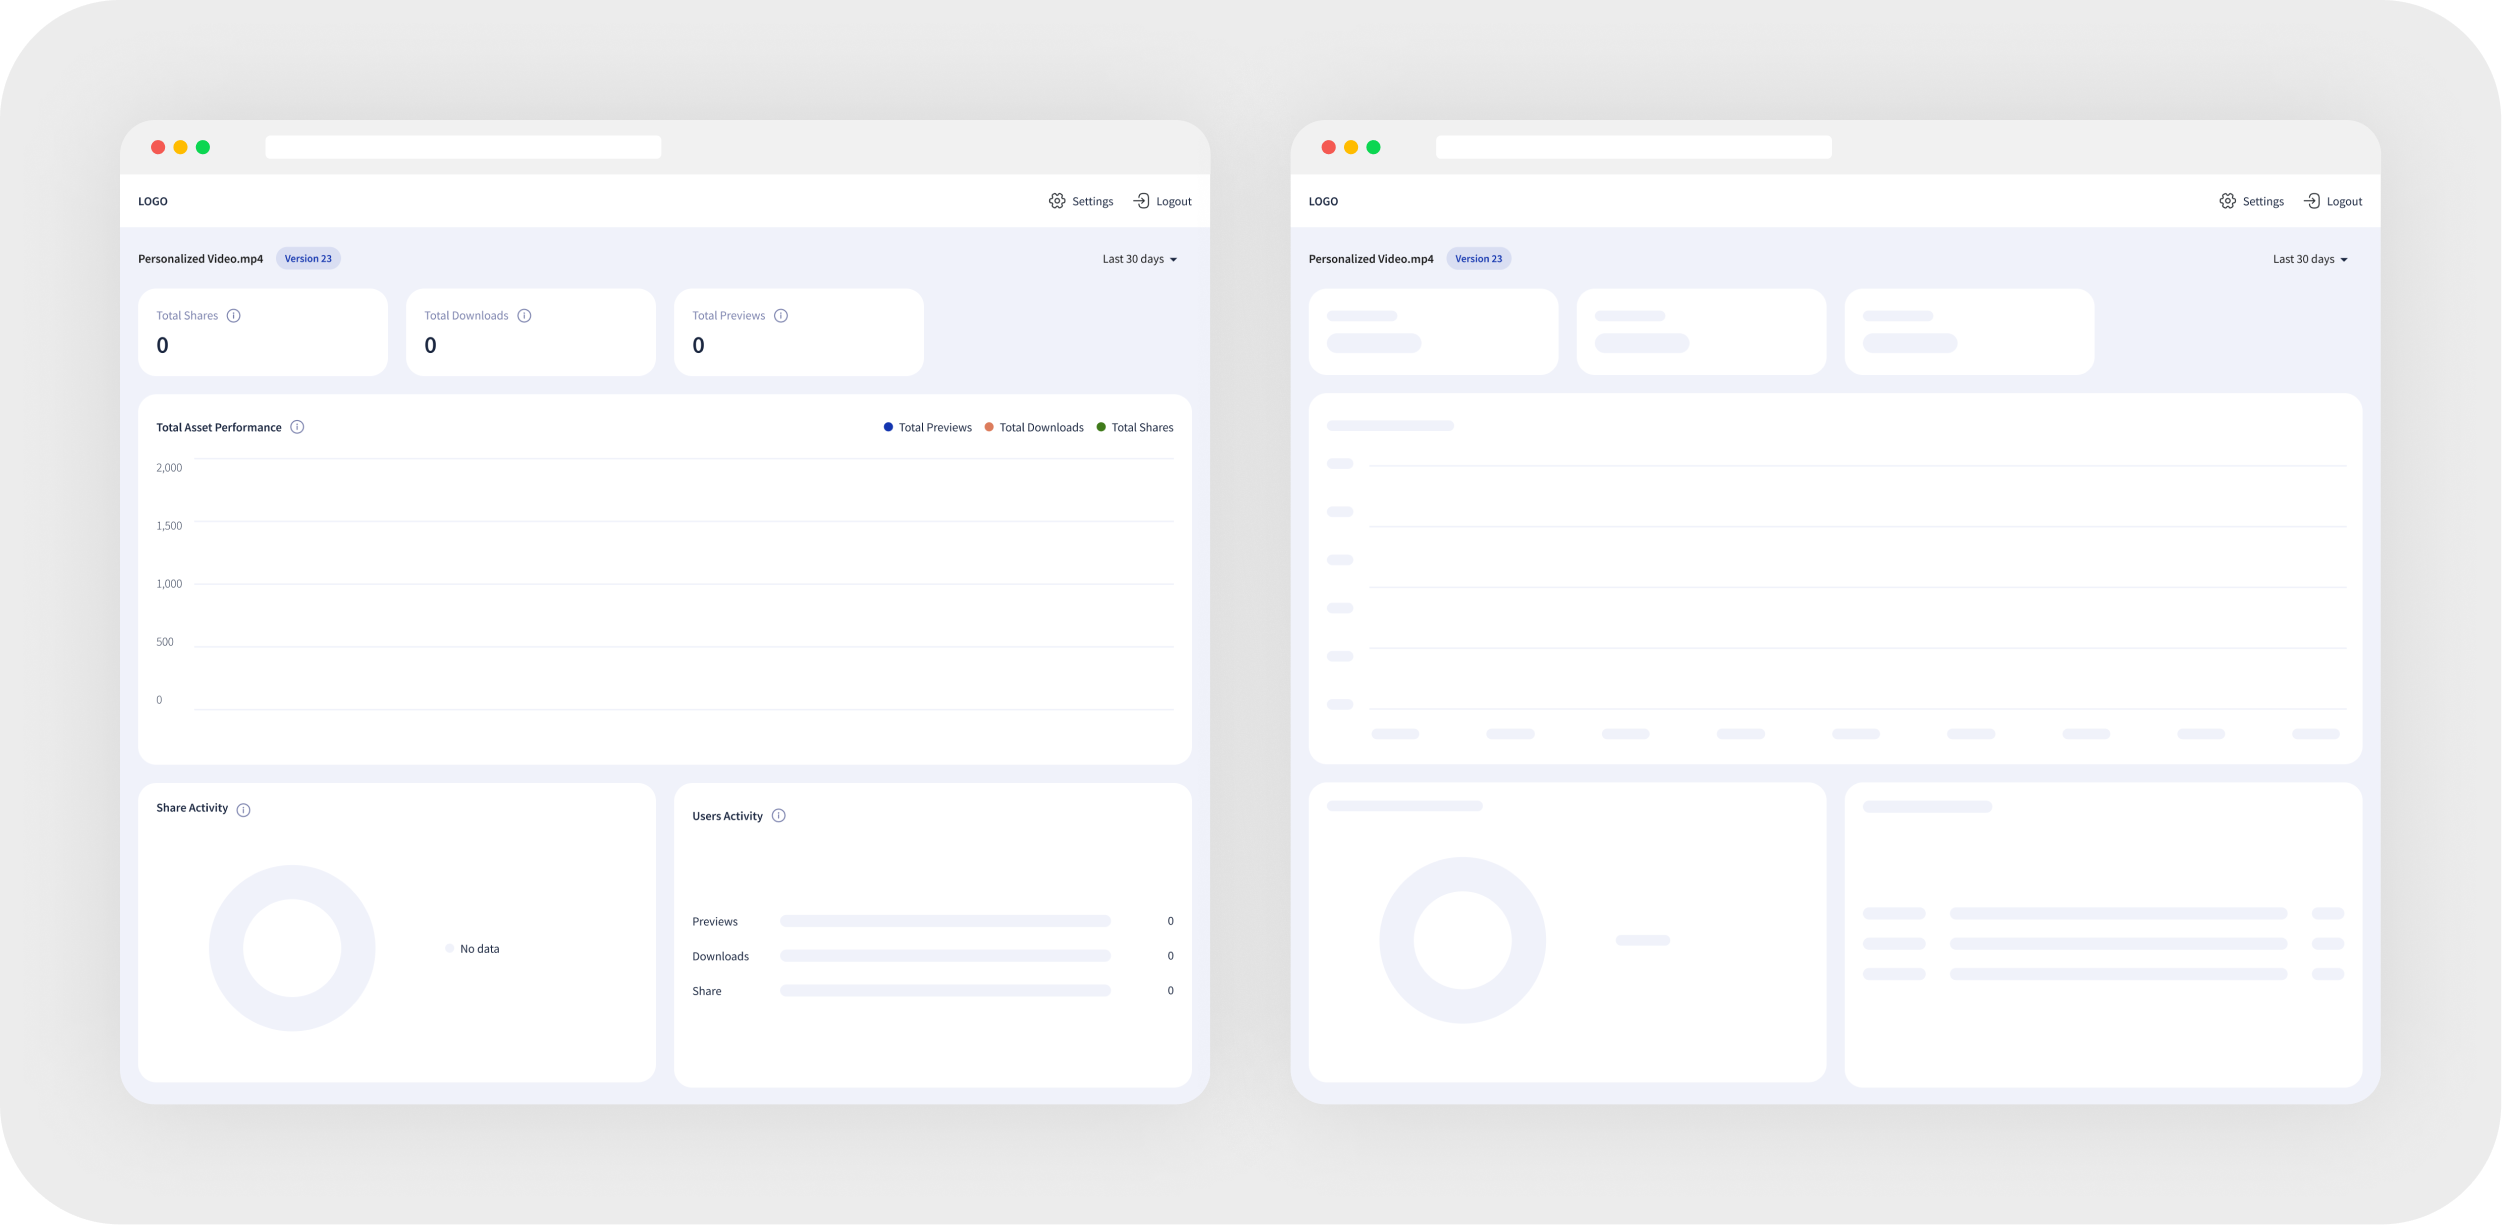
Displaying data effectively, highlighting key indicators, and providing analysis tools for comparison, while also addressing the need to load data efficiently and display it across different time periods.
Solution
The dashboards will display consistent metrics and widgets across all customers, with customizable views to compare data by customer or time period (e.g., yesterday, last 7 days). Skeleton screens will indicate data loading, and empty states will be prepared for cases with minimal changes.
Main Functional
Asset Level
The asset level focuses on organizing and managing individual digital assets, ensuring they are easily accessible and categorized for efficient use.
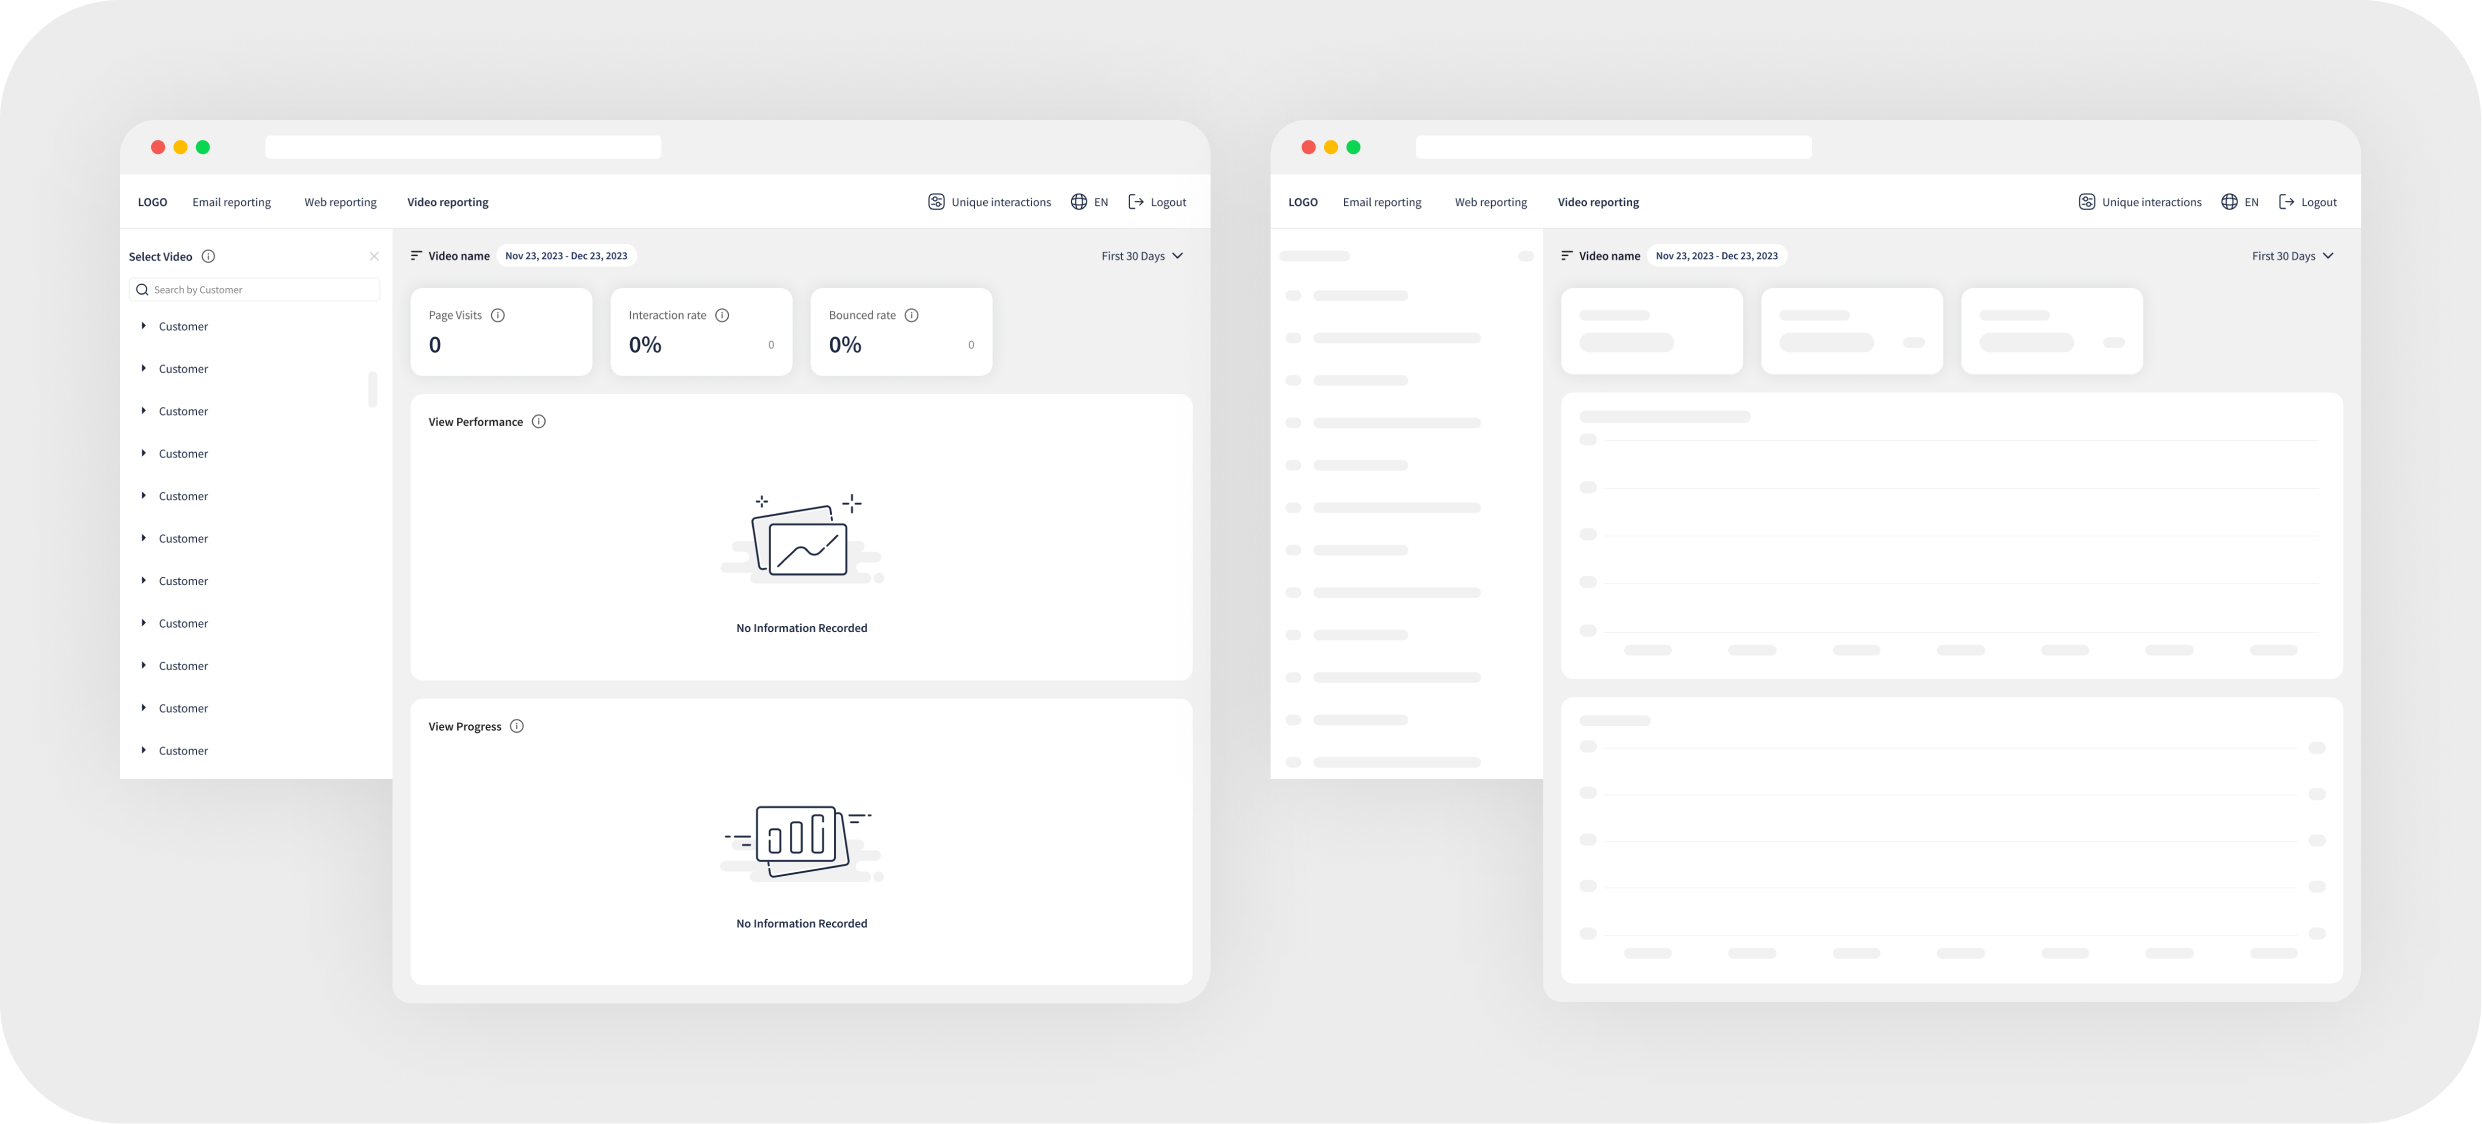
Empty Data & Skeleton Mode
To improve user experience during data loading and in cases where no data is available, skeleton screens indicate ongoing loading processes, while well-designed empty states provide clear messaging and guidance on the next steps.
Responsive Design for Various Devices
Ensuring an optimal user experience across devices by adapting the dashboard layout for tablets (both horizontal and vertical orientations) and mobile views. Key elements, such as navigation, widgets, and data visualization, are adjusted for readability, accessibility, and seamless interaction on smaller screens.

DAM Level
At the DAM (Digital Asset Management) level, the platform integrates and centralizes all digital assets, streamlining storage, retrieval, and sharing across teams.

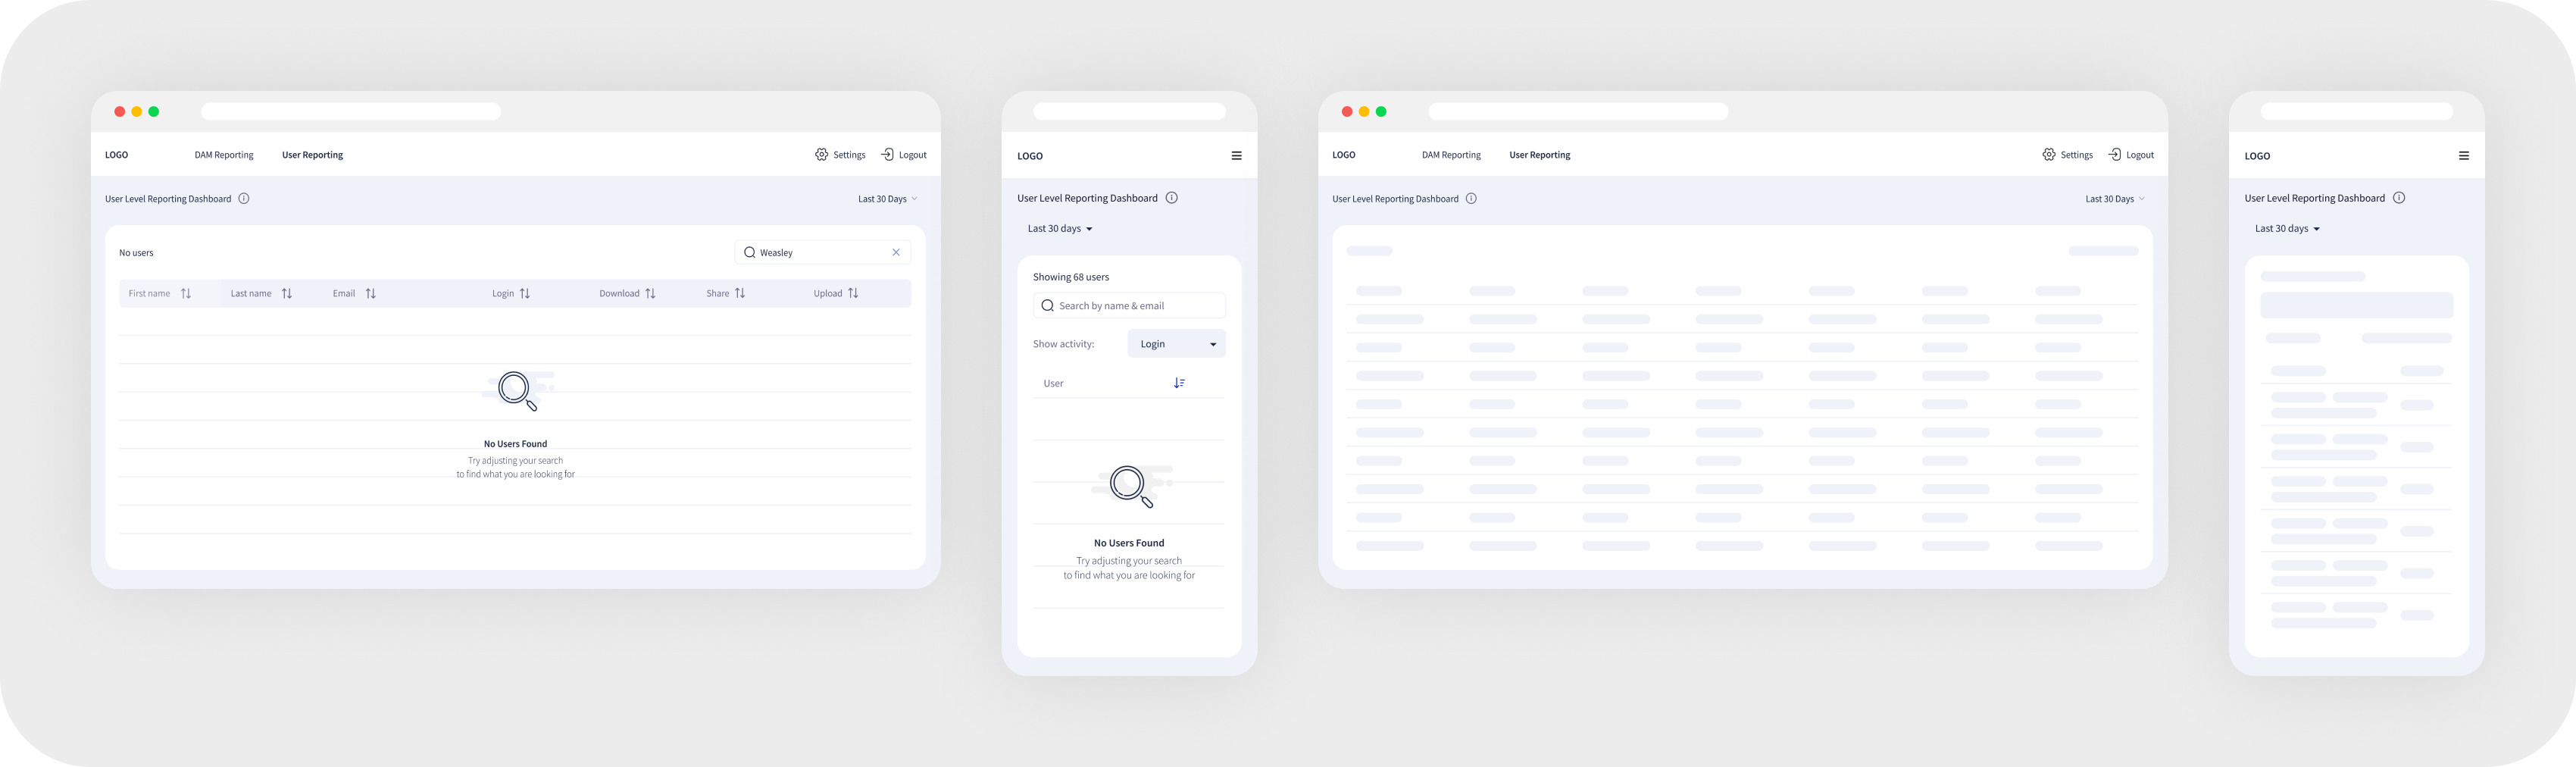
User Level
The user level controls access and permissions, allowing different roles to interact with and view assets or data according to their needs and authorization.

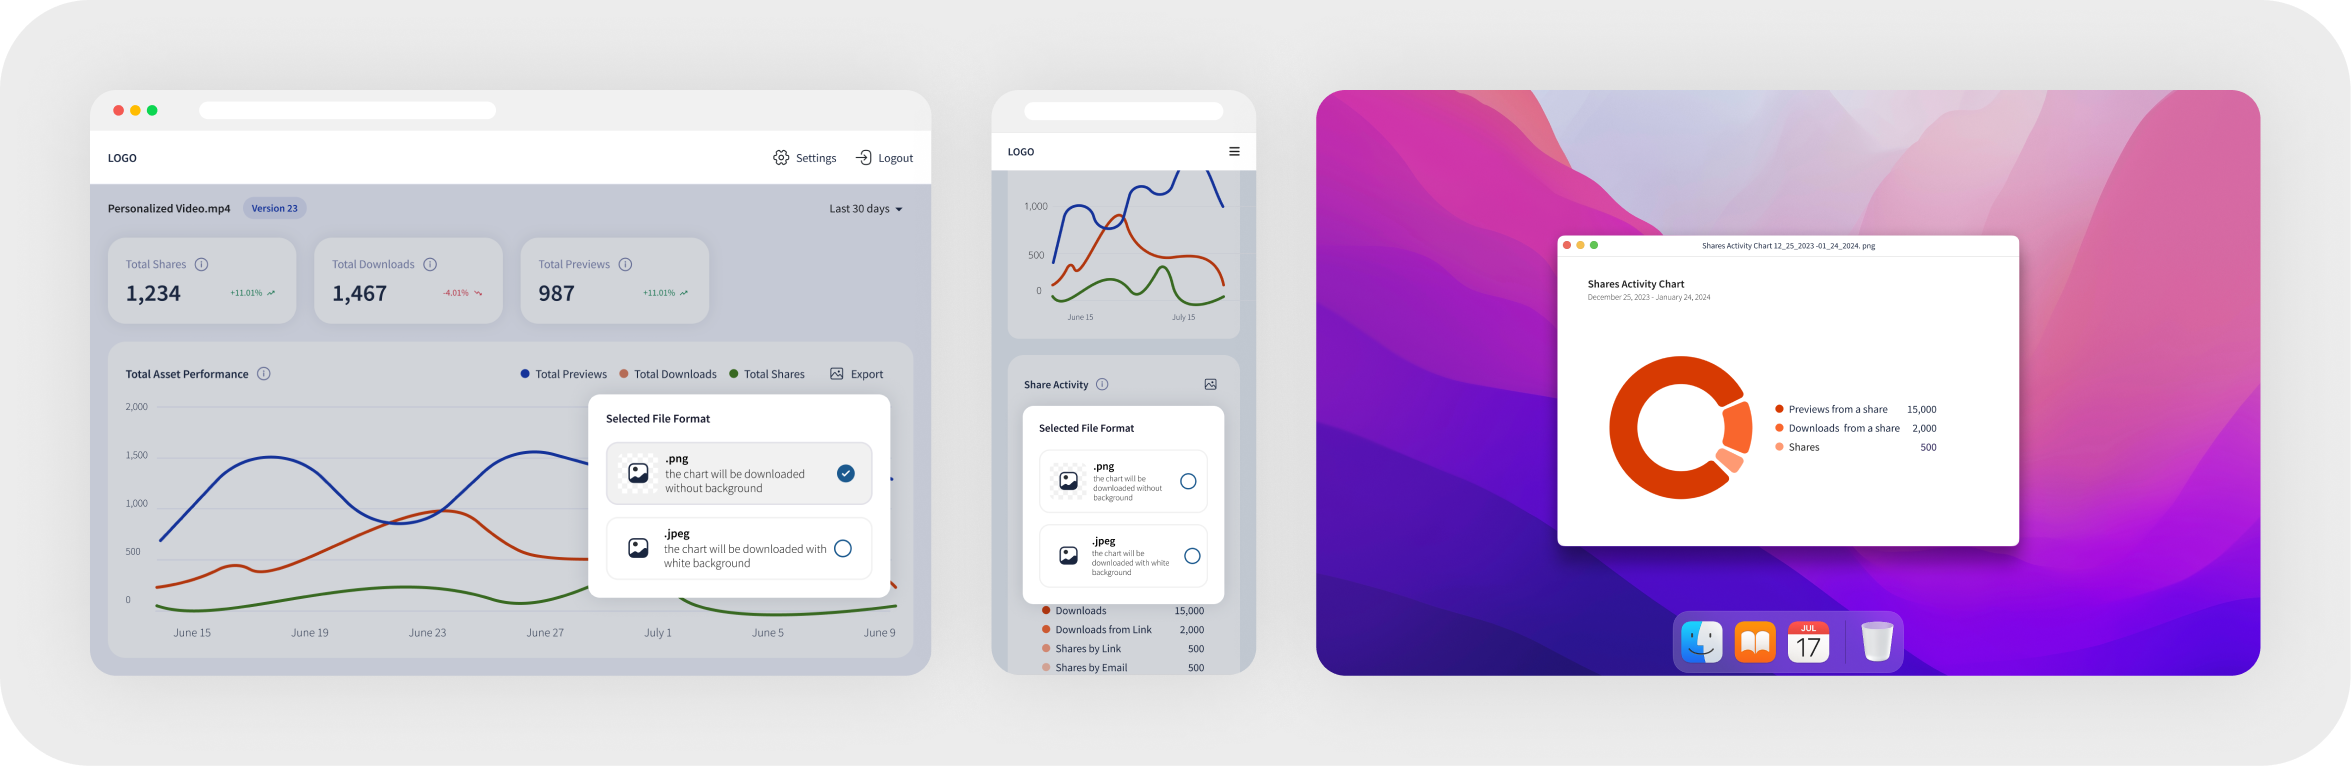
Export
Enables users to download visual data representations in various formats (e.g., PNG, JPEG, CSV) for easy sharing, reporting, and further analysis.
Email Campaign Reporting
Provides detailed insights into email campaign performance, including open rates, click-through rates, and conversions, helping businesses optimize their messaging strategies.


Web Reporting
Tracks user interactions and engagement on web platforms, offering analytics on visitor behavior, traffic sources, and conversion metrics for data-driven decision-making.


Video Reporting
Measures video content effectiveness by analyzing views, watch time, engagement, and audience retention to enhance personalization and content strategy.

User Management
Allows administrators to control user roles, permissions, and access levels, ensuring secure and efficient collaboration within the platform.

Error Pages
Provide clear and user-friendly messages with possible solutions when users encounter issues, ensuring they understand what went wrong and how to proceed.
Work Process
User Flow Creation


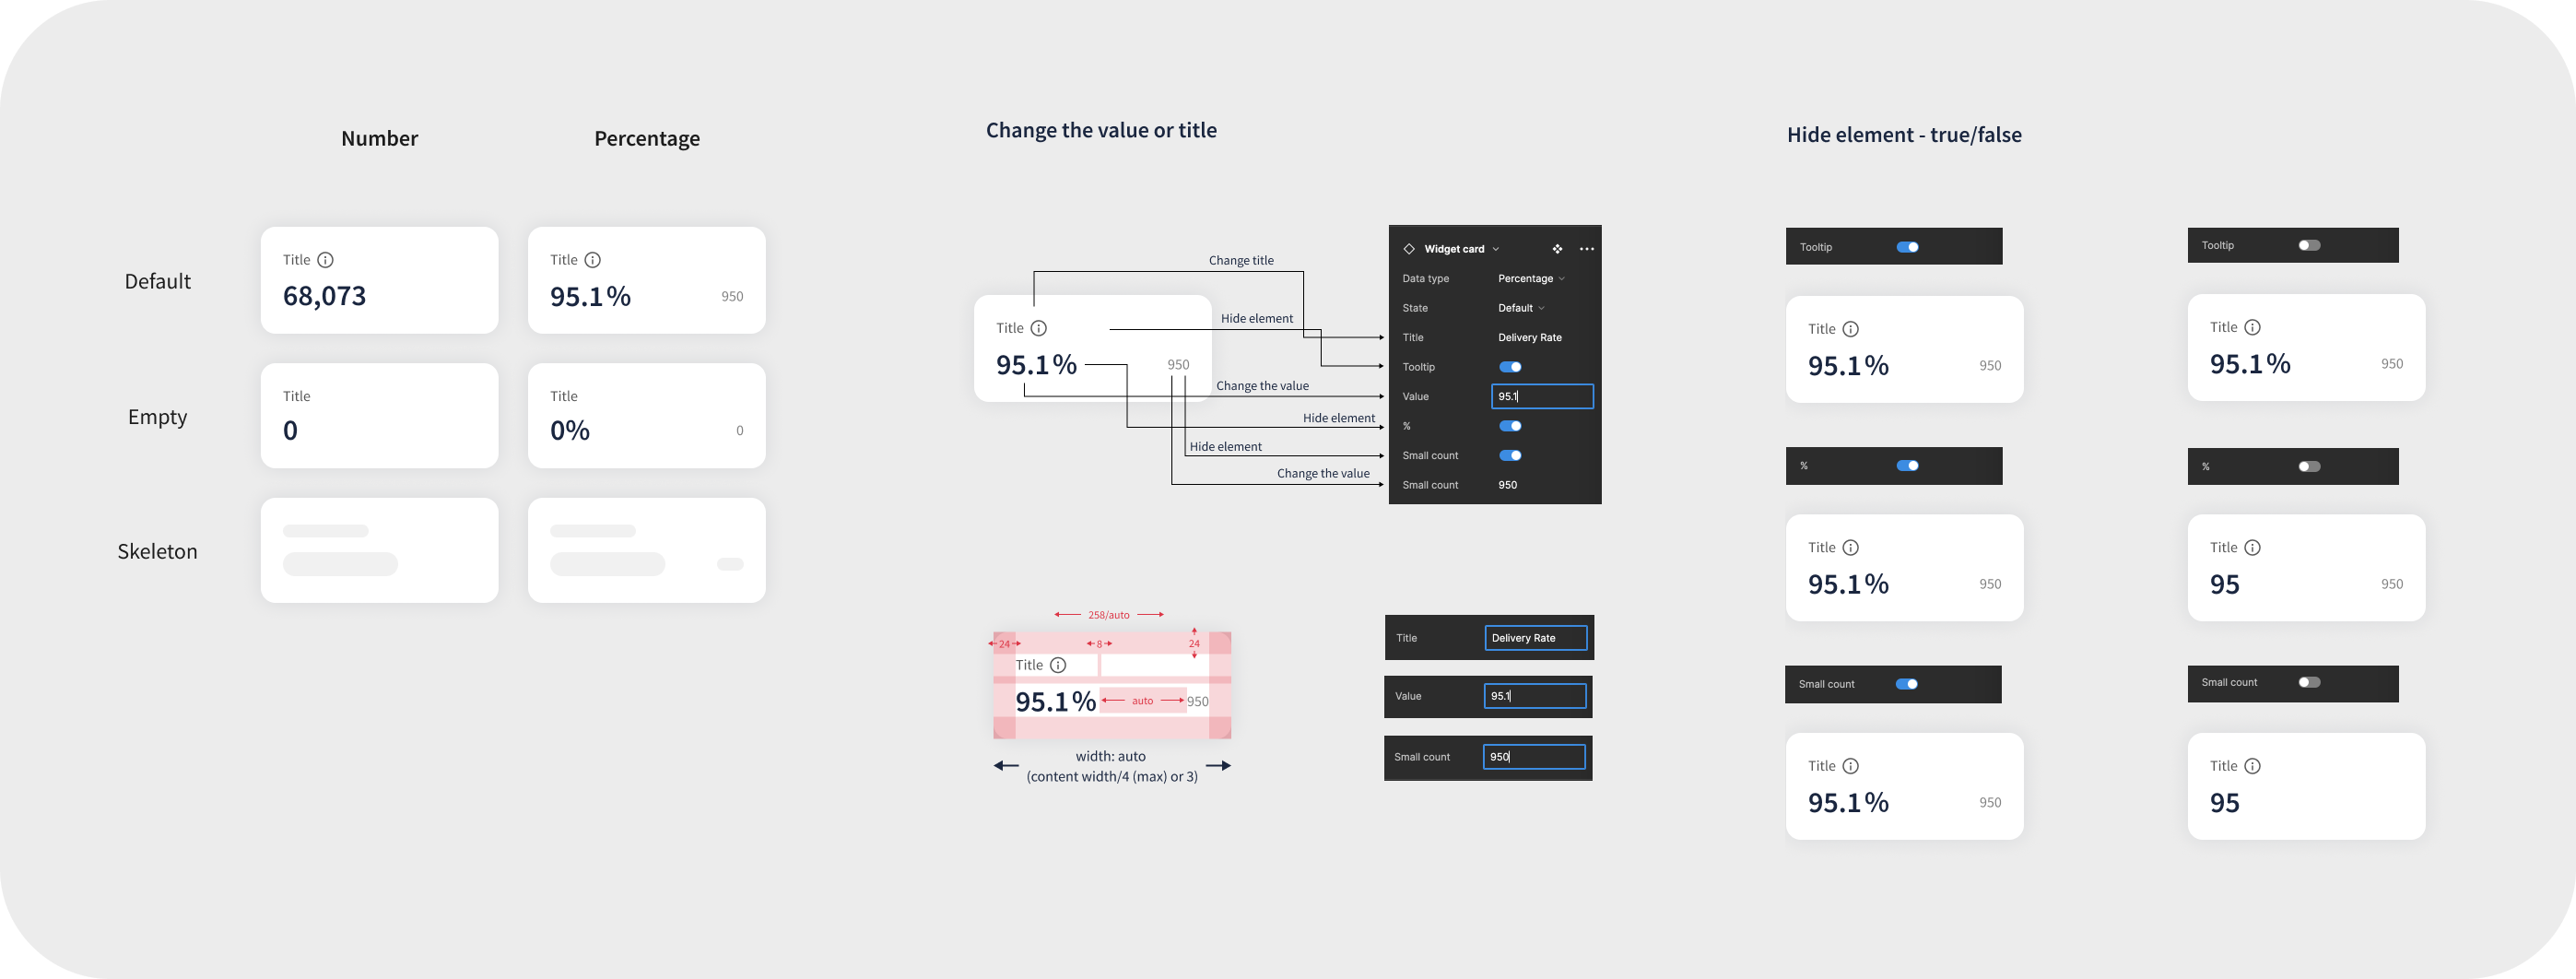
Data Visualization
Problem
How to display data for different time periods.
Solution
It is best to offer ready-made solutions: yesterday, last 7 days, last 30 days, last 60 days, last 90 days. However, leave the calendar for special cases.

Consistency
Problem
Projects are different, but within the same company, therefore, they must be similar.
Solution
Since my team and I developed projects from scratch, it was not difficult to build a Design System. However, there were several important differences that should be noted.
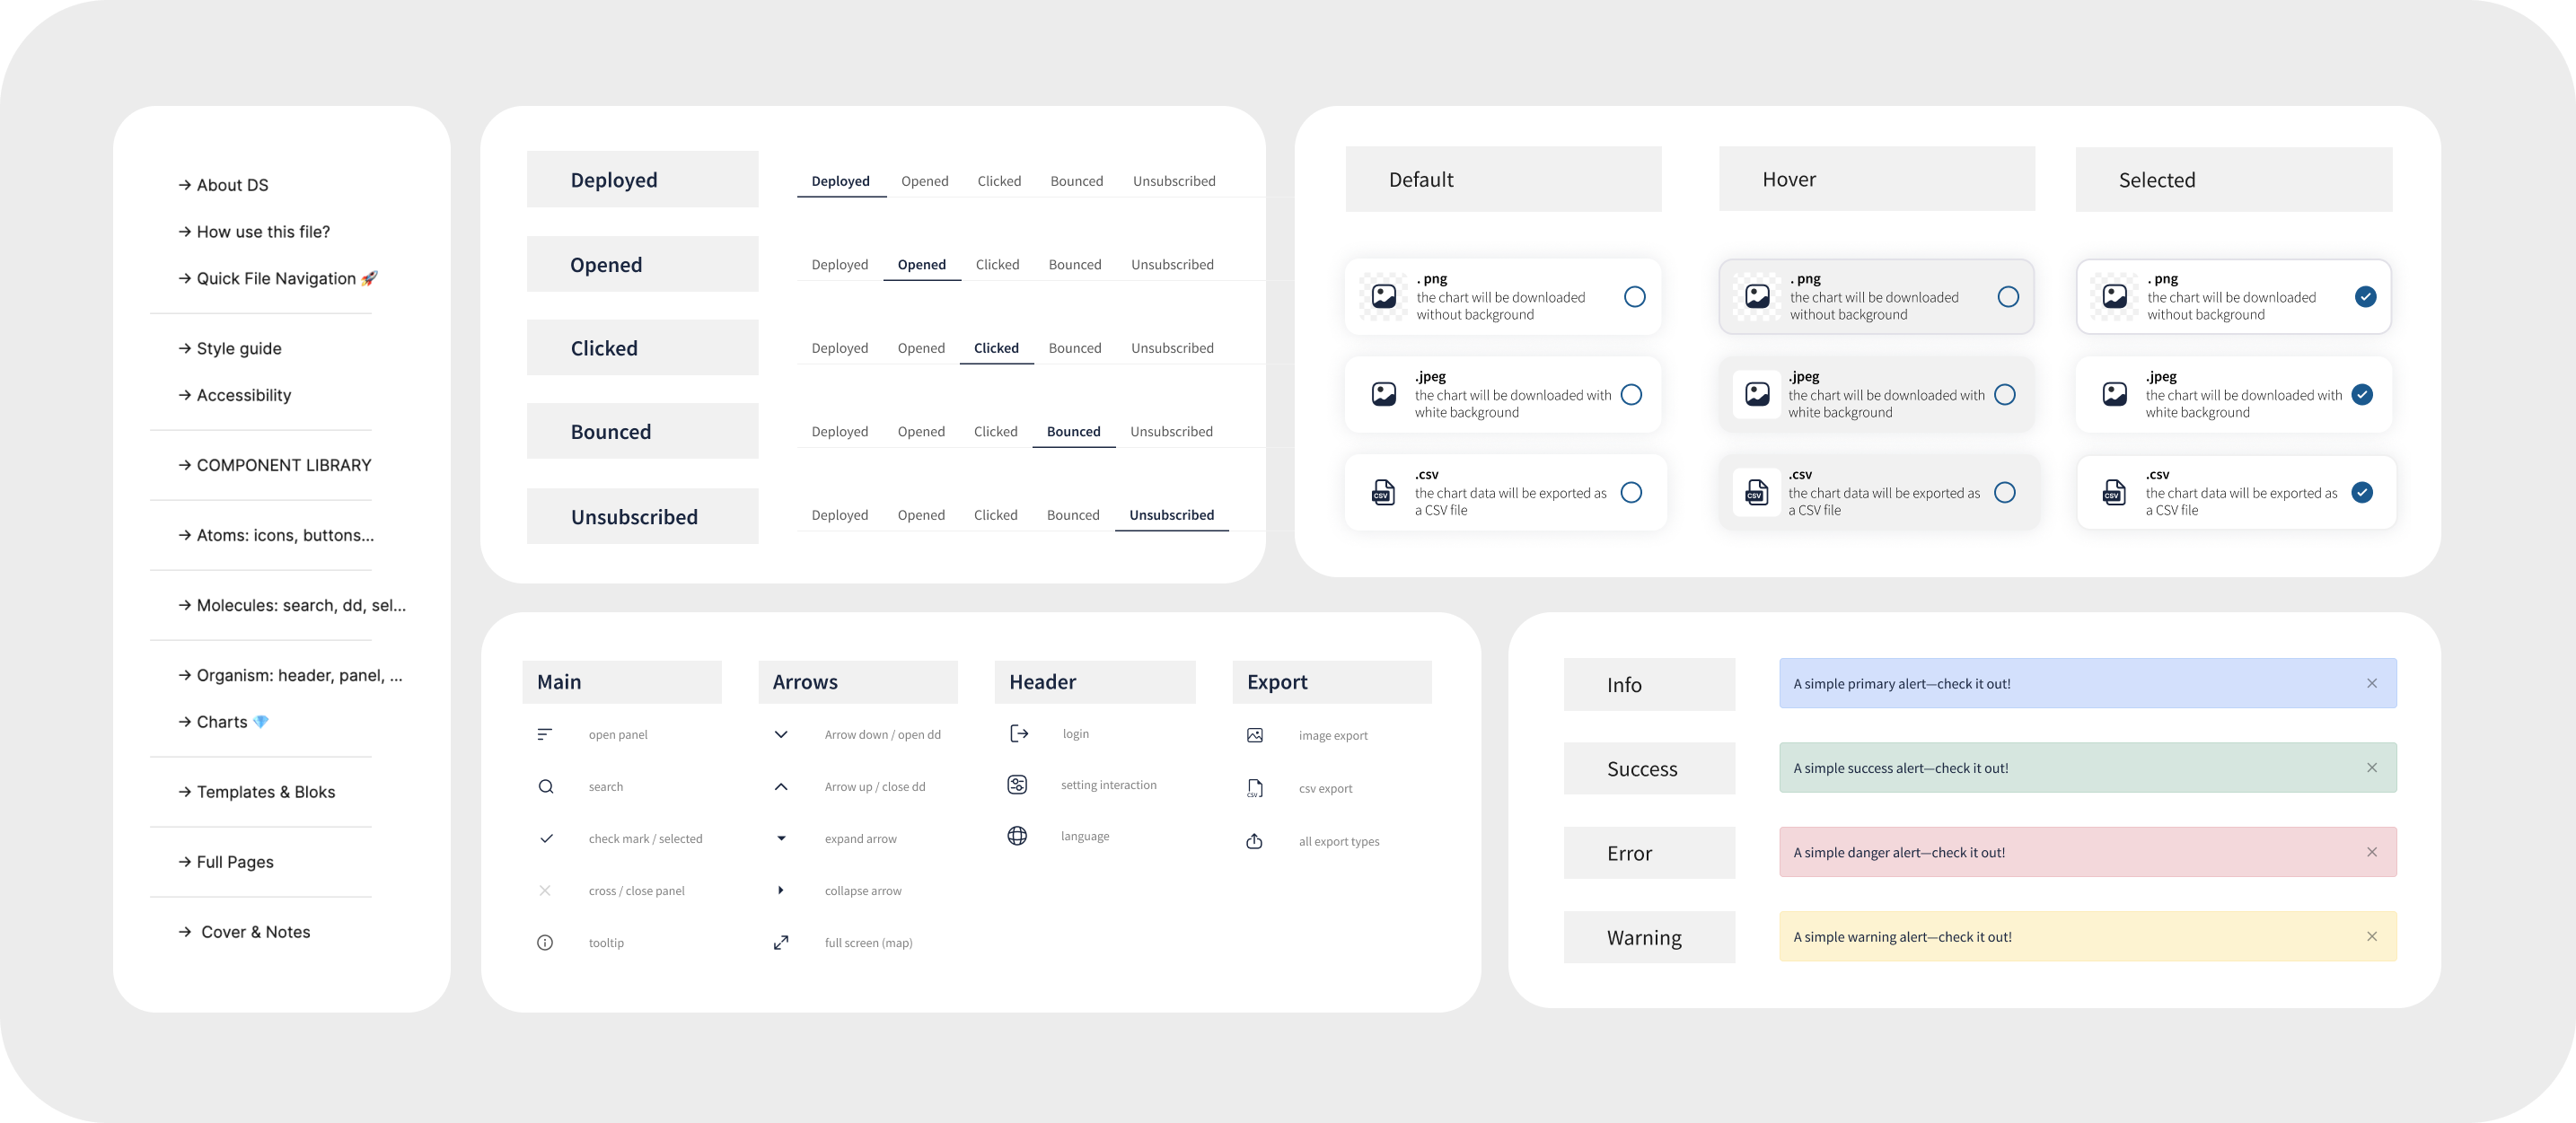
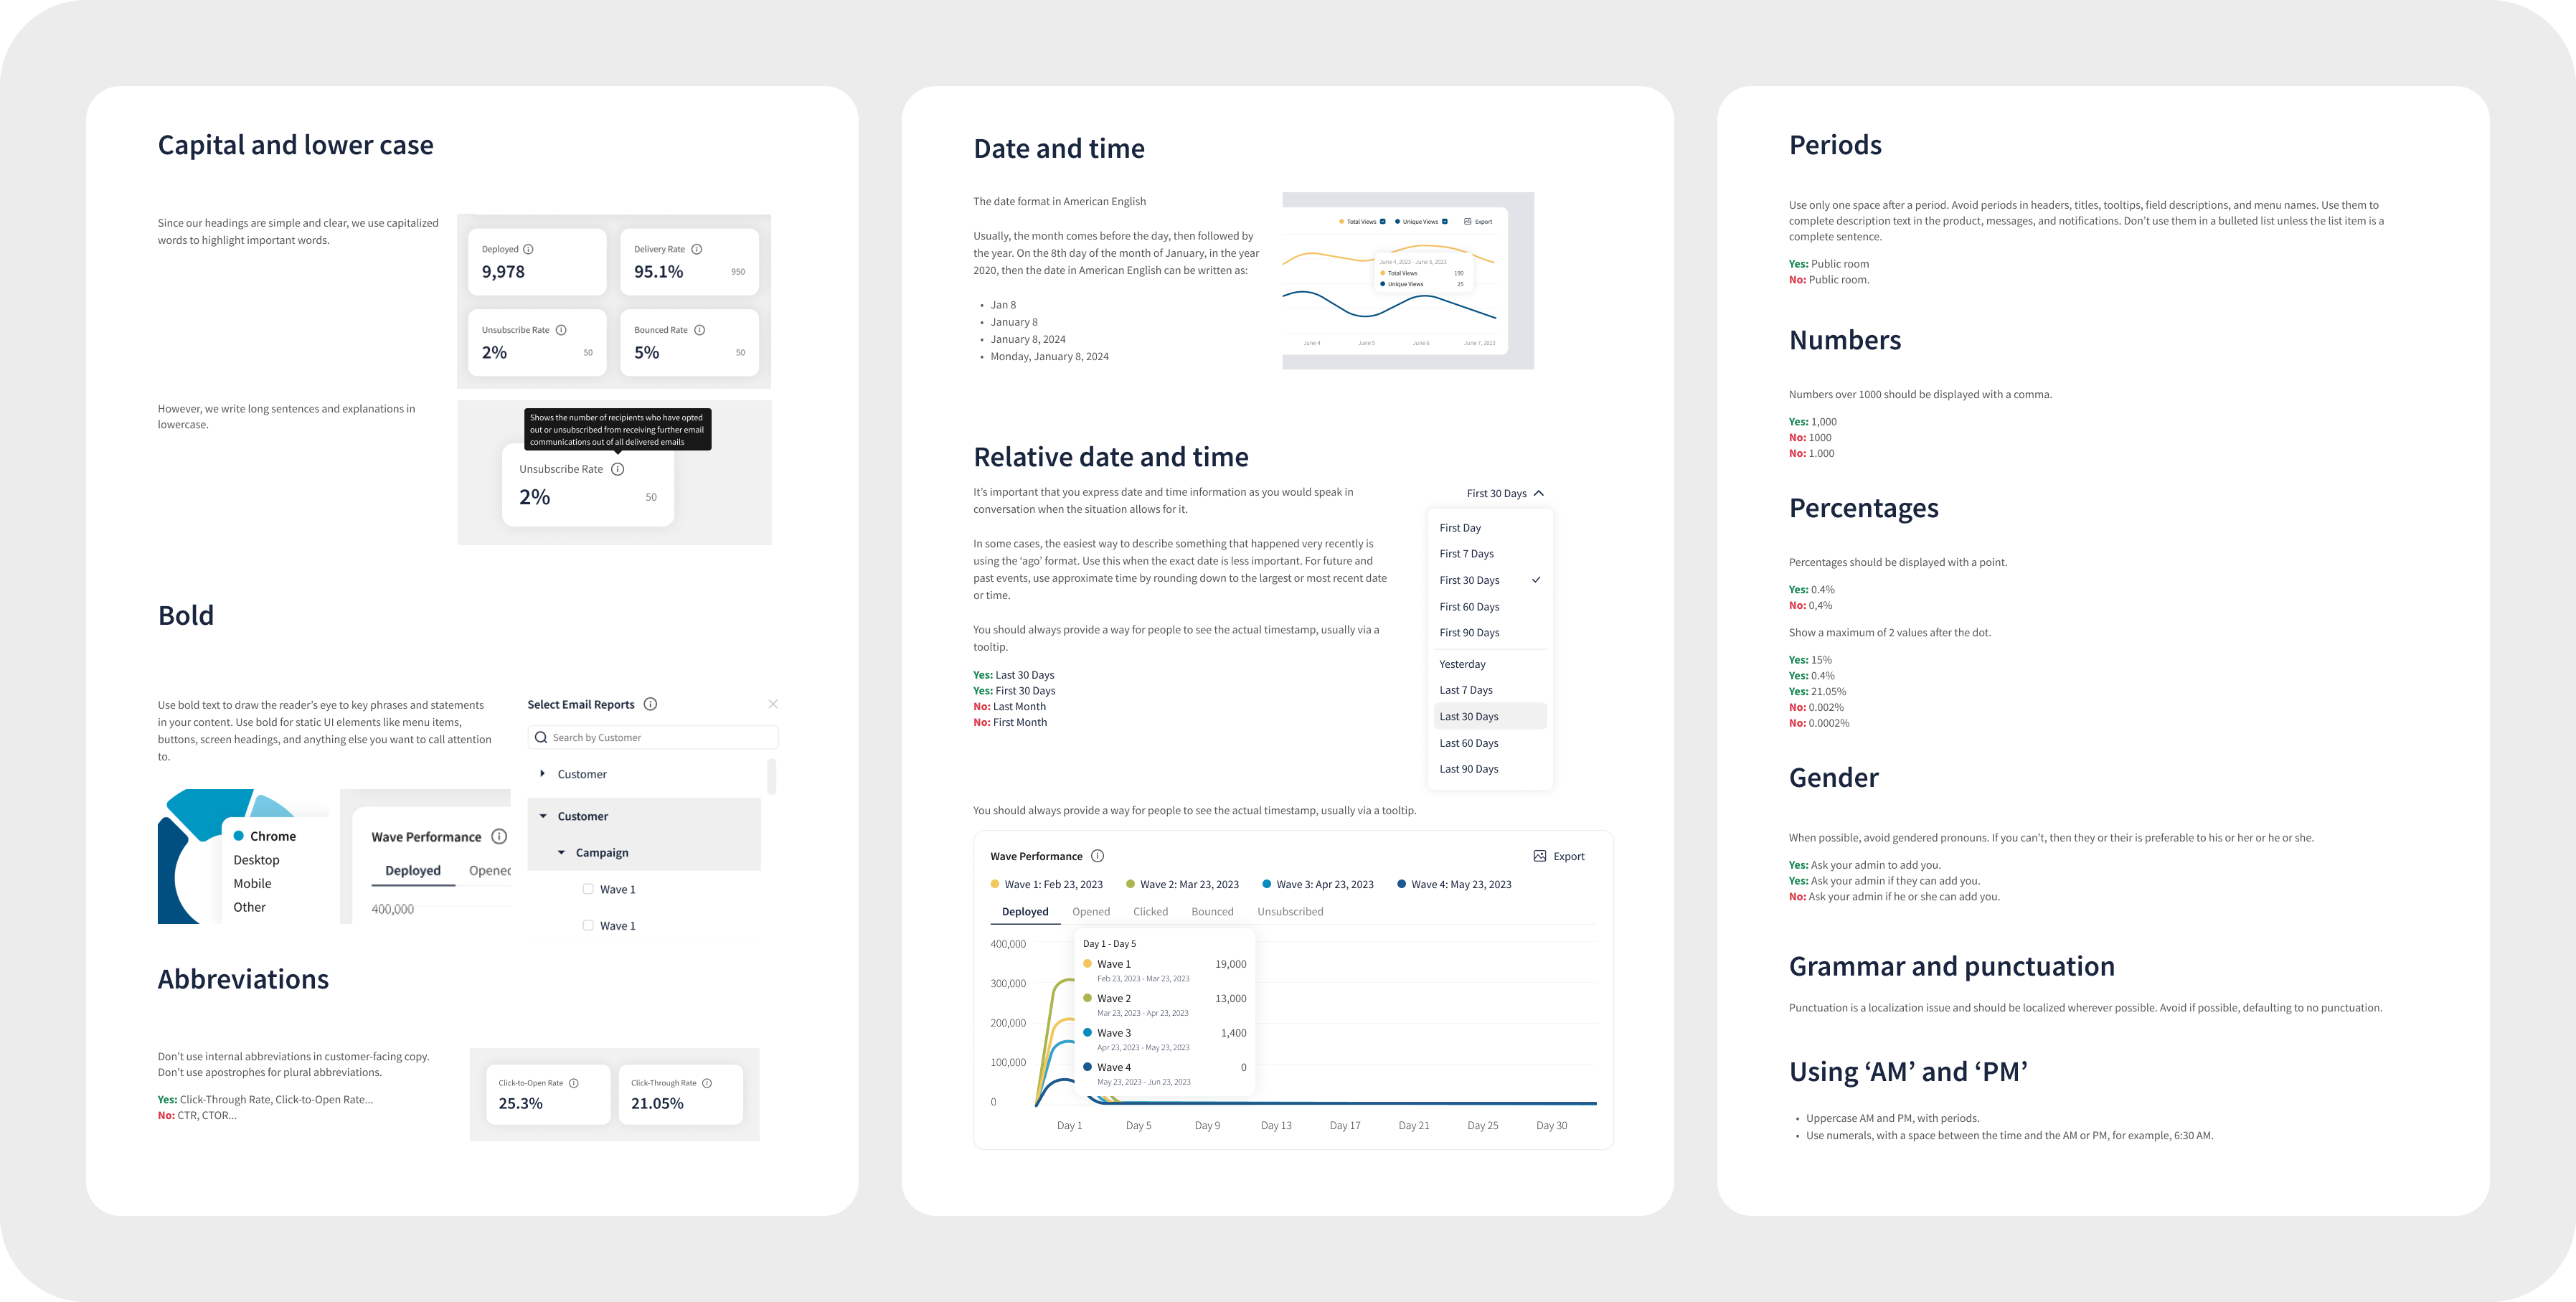
Text Accessibility

Data Visualizations
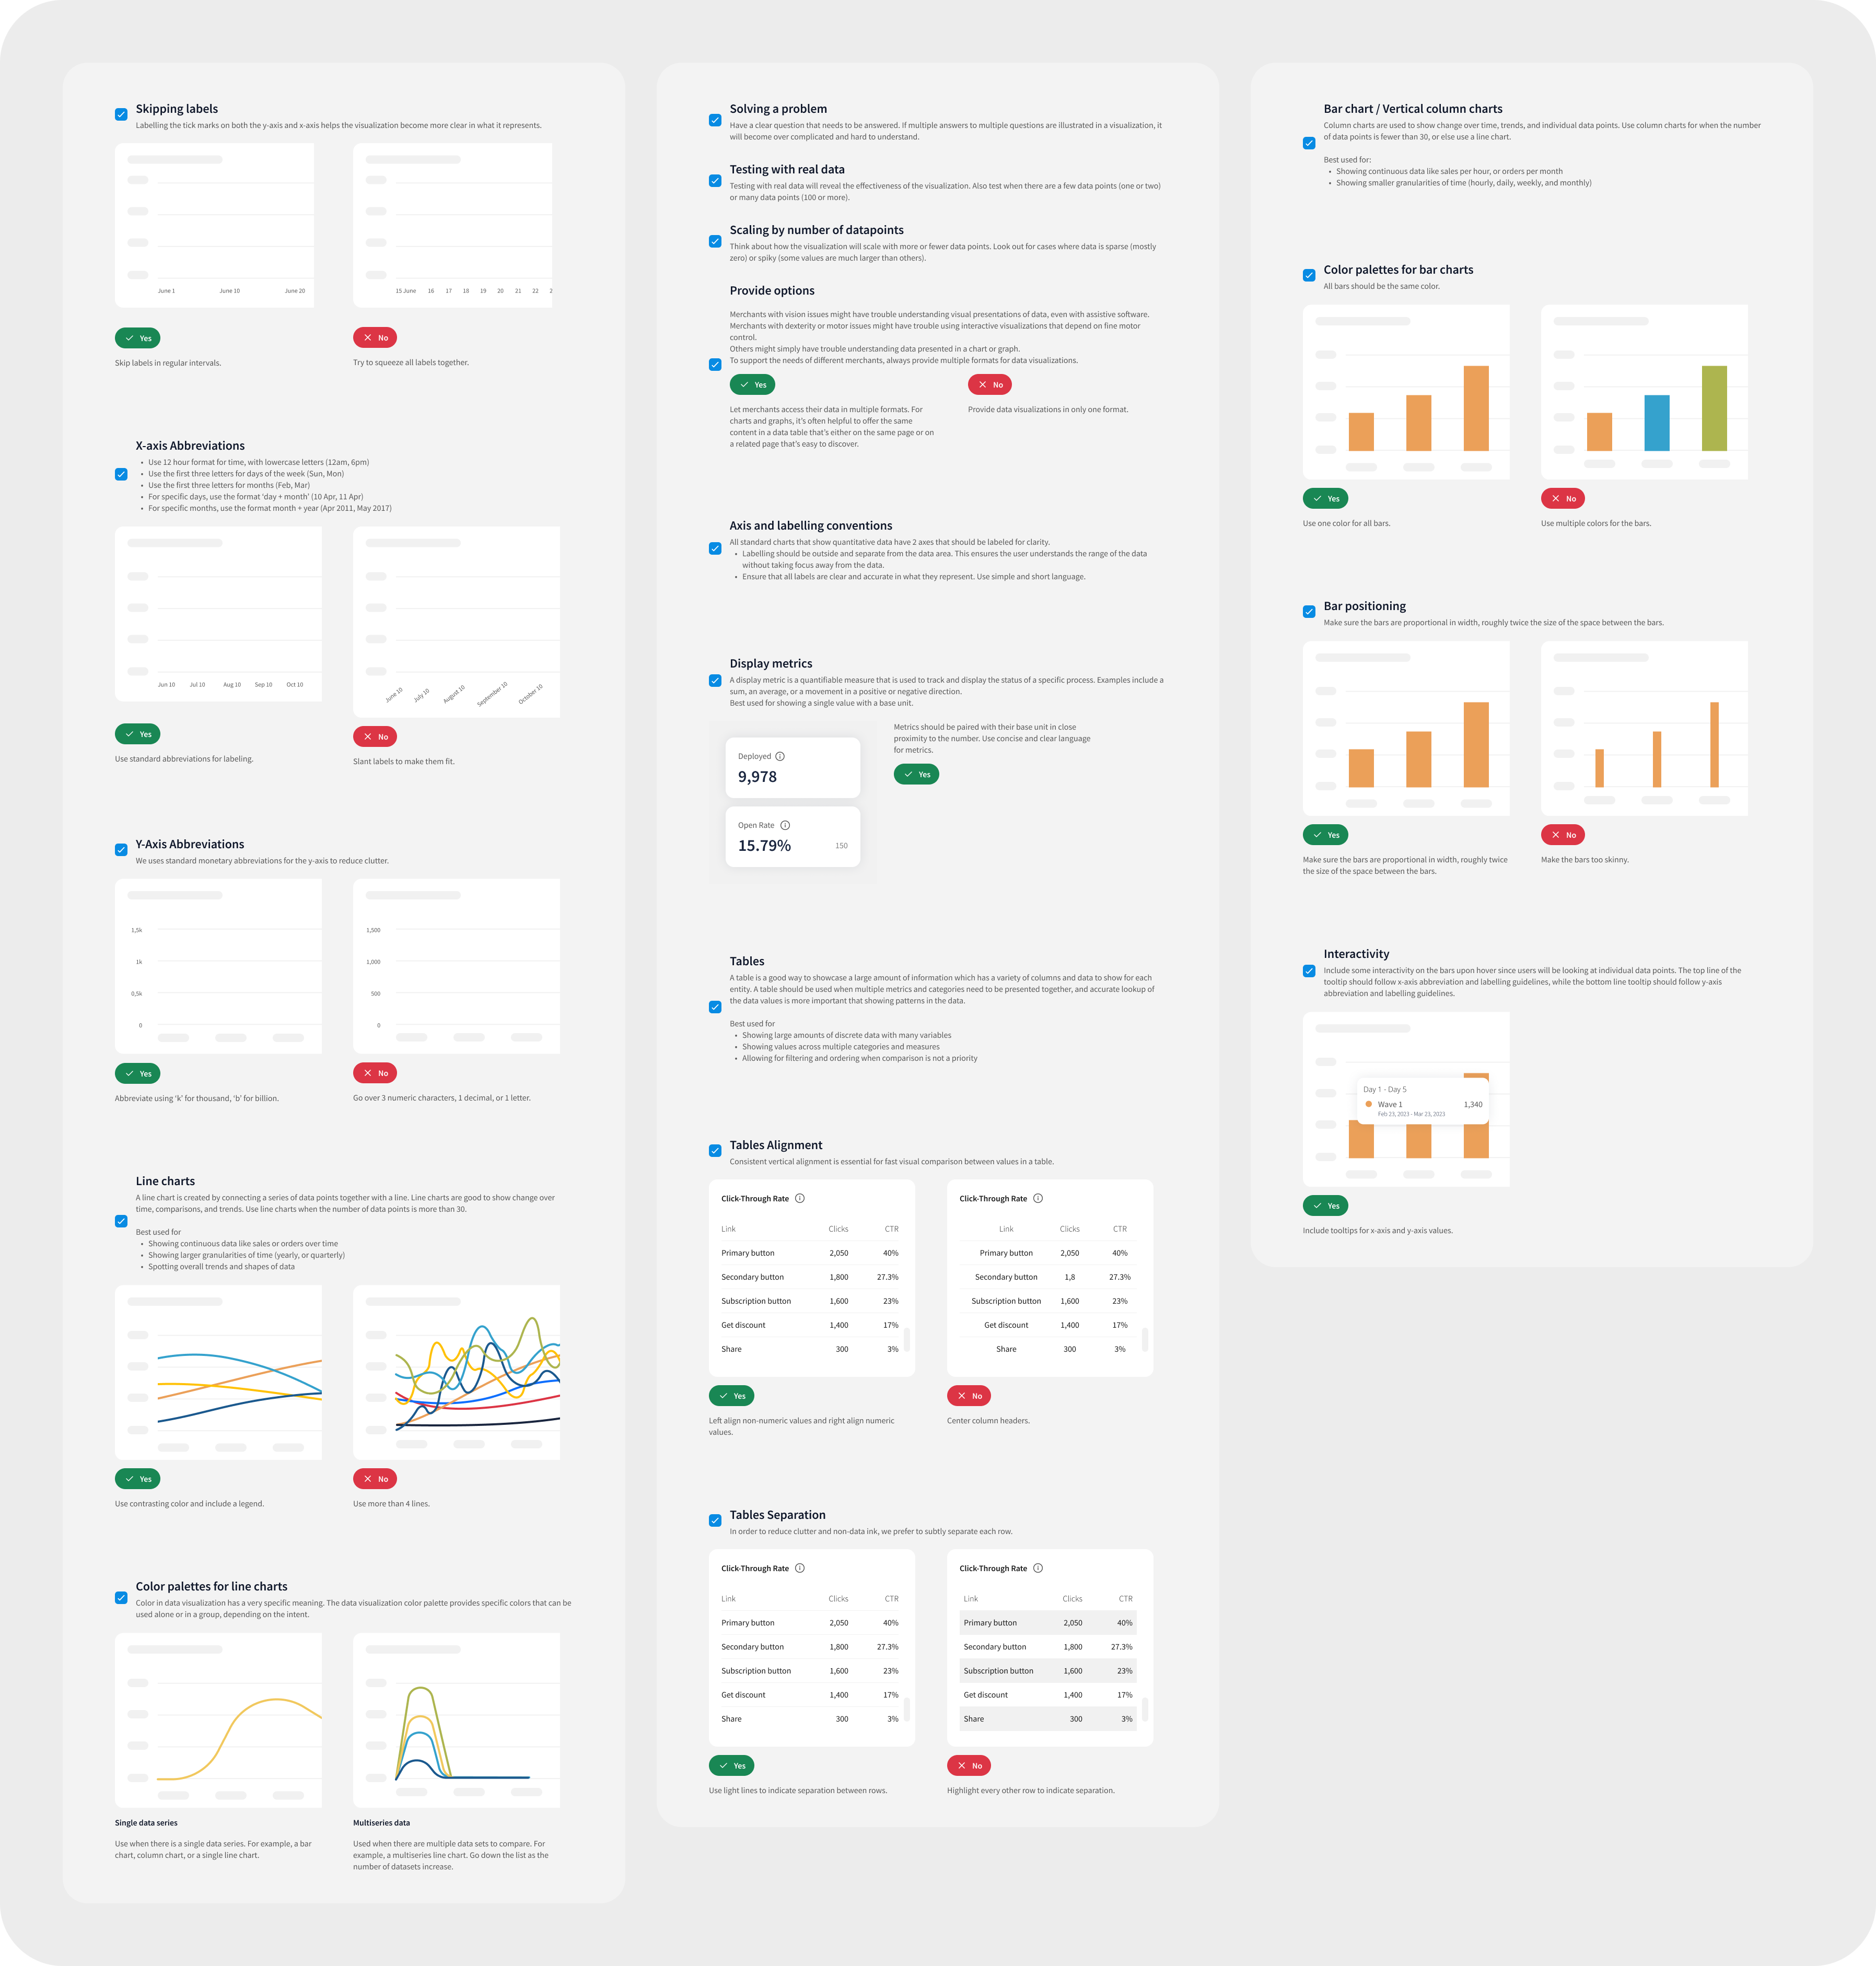
Tone of voice
Main challenges
Data Prioritization & Visualization
Challenge
Determining which metrics are most valuable and how best to present them for actionable insights.
Solution
Standardized key metrics across all dashboards while allowing drill-downs for deeper analysis. Users can compare data across time periods and clients for a more comprehensive view.
Performance & Loading Times
Challenge
Large datasets caused delays in loading dashboards, impacting user experience.
Solution
Implemented skeleton loaders to indicate data is being fetched and designed empty states to guide users when no data is available. Optimized data queries to improve speed.
Responsiveness & Adaptability
Challenge
Ensuring dashboards function smoothly across different devices and screen sizes.
Solution
Designed adaptive layouts for desktop, tablets (horizontal/vertical), and mobile views, ensuring critical insights remain accessible regardless of the device.
Selected projects
I've gained valuable experience in both B2B and B2C environments, with a focus on industries like SaaS, E-commerce, Fintech, and Marketing.
WORK WITH ME
WORK WITH ME
WORK WITH ME
WORK WITH ME